Chartify is an alternative visulization tool such as Seaborn in Python. It is an open-source Python library that wraps Bokeh to make it easier for data scientists to create charts.
I will show you only a few different types of plots here in this blog. However, there is a lot more you can do with this library and many parameters that you may change to create charts which spesific to your needs. To see all other options and detailed information about this library, you may visit the Chartify Github Repo.
Installation
Installation
- Chartify can be installed via pip:
!pip install chartify - Install chromedriver requirement (Optional. Needed for PNG output): Install google chrome. Download the appropriate version of chromedriver for your OS. Copy the executable file to a directory within your PATH.
PATH is where your executiable files are stored in your computer. There might be multiple directories that functions as PATH. View directorys in your PATH variable by typing echo $PATH to your terminal. Once you figured, copy chromedriver to the appropriate directory, e.g.: cp chromedriver /usr/local/bin
Import
After installation you may use chartify libary by importing to your notebook. I also imported numpy and pandas library to use transorming data in our example in this notebook.
import chartify
import numpy as np
import pandas as pd
Example data
Lets generate some example data.
chartify.examples.example_data().head(10)
| date | country | fruit | unit_price | quantity | total_price | |
|---|---|---|---|---|---|---|
| 0 | 2017-10-21 | US | Banana | 0.303711 | 4 | 1.214846 |
| 1 | 2017-05-30 | JP | Banana | 0.254109 | 4 | 1.016436 |
| 2 | 2017-05-21 | CA | Banana | 0.268635 | 4 | 1.074539 |
| 3 | 2017-09-18 | BR | Grape | 2.215277 | 2 | 4.430554 |
| 4 | 2017-12-08 | US | Banana | 0.308337 | 5 | 1.541687 |
| 5 | 2017-06-05 | GB | Apple | 0.870118 | 2 | 1.740235 |
| 6 | 2017-09-05 | JP | Banana | 0.279179 | 7 | 1.954252 |
| 7 | 2017-08-27 | CA | Apple | 1.025265 | 4 | 4.101059 |
| 8 | 2017-09-14 | CA | Apple | 1.078831 | 4 | 4.315324 |
| 9 | 2017-05-26 | GB | Grape | 1.840909 | 2 | 3.681818 |
Example Plots
Now we can do some transformation and create various types of plots using cartify. Here are some exapmles.
Scatter
ch = chartify.Chart(blank_labels=True, x_axis_type='datetime')
ch.plot.scatter(
    data_frame=data,
    x_column='date',
    y_column='unit_price')
ch.set_title("Scatterplot")
ch.set_subtitle("Plot two numeric values.")
ch.show('png')

# Plot the data
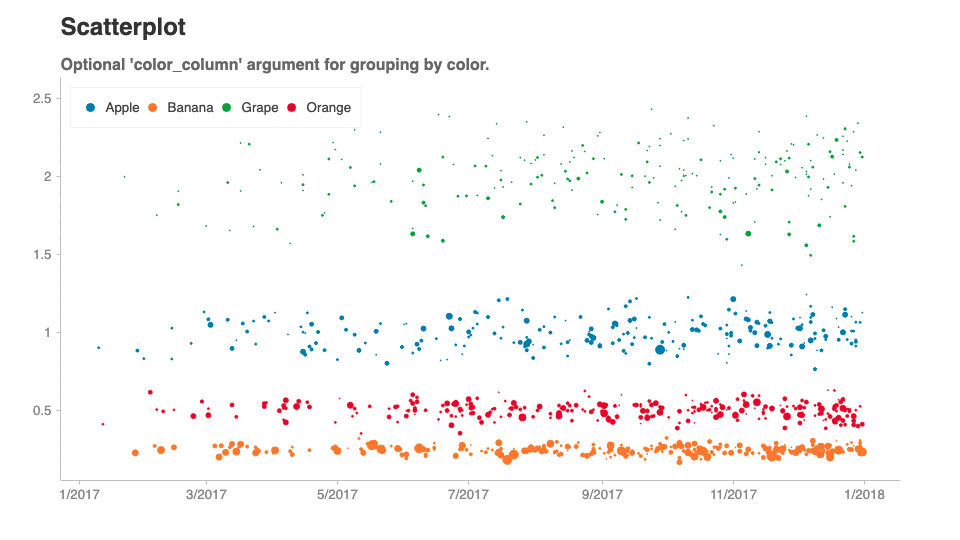
ch = chartify.Chart(blank_labels=True, x_axis_type='datetime')
ch.plot.scatter(
    data_frame=data,
    x_column='date',
    y_column='unit_price',
    size_column='quantity',
    color_column='fruit')
ch.set_title("Scatterplot")
ch.set_subtitle("Optional 'color_column' argument for grouping by color.")
ch.show('png')
Text
# Manipulate the data
price_and_quantity_by_country = (
    data.groupby('country')[['total_price', 'quantity']].sum()
    .reset_index())
print(price_and_quantity_by_country.head())

      country  total_price  quantity
    0      BR   208.553175       215
    1      CA   473.922173       659
    2      GB   370.257657       446
    3      JP   263.204503       424
    4      US   645.058909      1134

# Plot the data
ch = chartify.Chart(blank_labels=True)
ch.plot.scatter(
    data_frame=price_and_quantity_by_country,
    x_column='total_price',
    y_column='quantity',
    color_column='country')
ch.style.color_palette.reset_palette_order()
ch.plot.text(
    data_frame=price_and_quantity_by_country,
    x_column='total_price',
    y_column='quantity',
    text_column='country',
    color_column='country',
    x_offset=1,
    y_offset=-1,
    font_size='10pt')
ch.set_title("Text")
ch.set_subtitle("Labels for specific observations.")
ch.show('png')

Line
price_by_date_and_country = (
    data.groupby(['date', 'fruit'])['total_price'].sum()
    .reset_index()  # Move 'date' and 'country' from index to column
    )
print(price_by_date_and_country.head())

    date   fruit  total_price
0 2017-01-10   Apple     1.808778
1 2017-01-12  Orange     0.829621
2 2017-01-22   Grape     1.998476
3 2017-01-27  Banana     1.390764
4 2017-01-28   Apple     2.658465

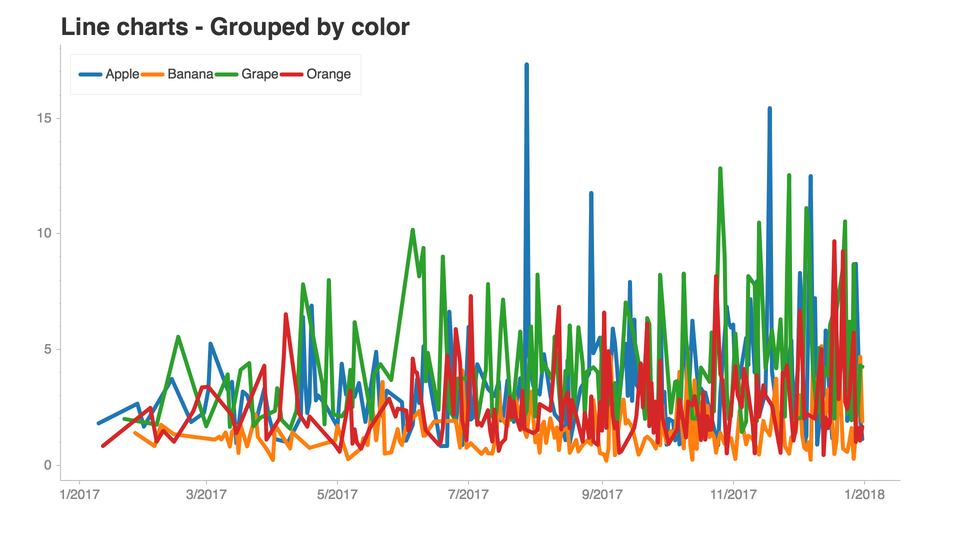
ch = chartify.Chart(blank_labels=True, x_axis_type='datetime')
ch.set_title("Line charts - Grouped by color")
ch.plot.line(
    # Data must be sorted by x column
    data_frame=price_by_date_and_country.sort_values('date'),
    x_column='date',
    y_column='total_price',
    color_column='fruit')
ch.show('png')
Area
# Sum price grouped by date
price_by_date = (data.groupby(['date'])['total_price'].agg(
    ['mean', 'std', 'count'])
    .loc['2017-12-01':].assign(
        lower_ci=lambda x: x['mean'] - 1.96 * x['std'] / x['count']**.5,
        upper_ci=lambda x: x['mean'] + 1.96 * x['std'] / x['count']**.5)
    .reset_index())
print(price_by_date.head())

    date      mean       std  count  lower_ci  upper_ci
0 2017-12-01  2.130242  1.723854      3  0.179518  4.080967
1 2017-12-02  1.801198  1.385051     10  0.942735  2.659662
2 2017-12-03  2.157626  1.163018      7  1.296050  3.019202
3 2017-12-04  0.923048  0.472394      4  0.460102  1.385994
4 2017-12-05  2.179000  1.258695      7  1.246546  3.111454

# Plot the data
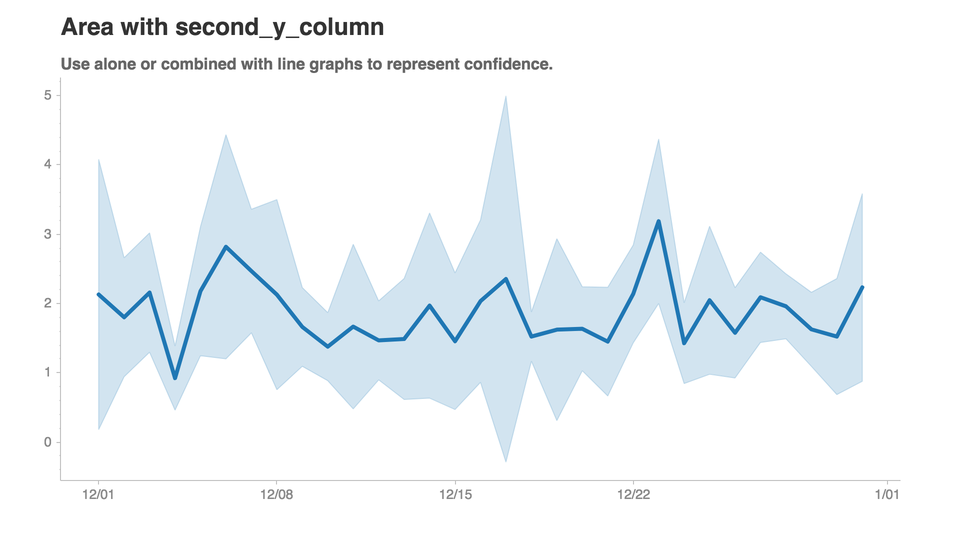
ch = chartify.Chart(blank_labels=True, x_axis_type='datetime')
ch.set_title("Area with second_y_column")
ch.set_subtitle(
    "Use alone or combined with line graphs to represent confidence."
)
ch.plot.area(
    data_frame=price_by_date,
    x_column='date',
    y_column='lower_ci',
    second_y_column='upper_ci')
# Reset to ensure same color of line & shaded interval
ch.style.color_palette.reset_palette_order()
ch.plot.line(
    data_frame=price_by_date,
    x_column='date',
    y_column='mean')
ch.show('png')
Bar plot
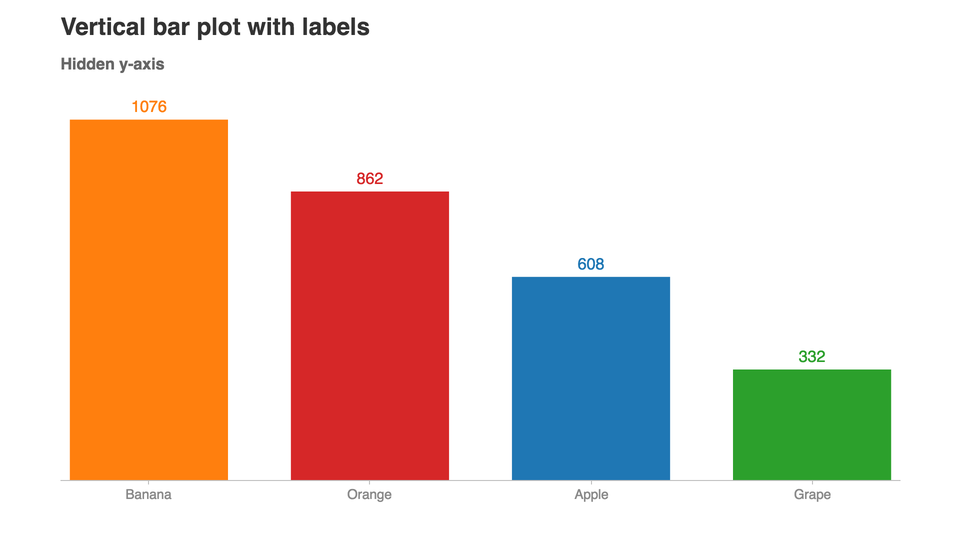
ch = chartify.Chart(x_axis_type='categorical', blank_labels=True)
ch.set_title("Vertical bar plot with labels")
ch.set_subtitle("Hidden y-axis")
ch.plot.bar(
    data_frame=quantity_by_fruit,
    categorical_columns='fruit',
    numeric_column='quantity',
    color_column='fruit')
ch.style.color_palette.reset_palette_order()
ch.plot.text(
    data_frame=quantity_by_fruit,
    categorical_columns='fruit',
    numeric_column='quantity',
    text_column='quantity',
    color_column='fruit')
# Adjust the axis range to prevent clipping of the text labels.
ch.axes.set_yaxis_range(0, 1200)
ch.axes.hide_yaxis()
ch.show('png')
Bar (grouped)
quantity_by_fruit_and_country = (data.groupby(
    ['fruit', 'country'])['quantity'].sum().reset_index())
print(quantity_by_fruit_and_country.head())

    fruit country  quantity
0  Apple      BR        57
1  Apple      CA       144
2  Apple      GB       177
3  Apple      JP        65
4  Apple      US       165

# Plot the data
ch = chartify.Chart(blank_labels=True, x_axis_type='categorical')
ch.set_title("Grouped bar chart")
ch.set_subtitle(
    "Pass a list to group by multiple factors. Color grouped by 'fruit'")
ch.plot.bar(
    data_frame=quantity_by_fruit_and_country,
    categorical_columns=['fruit', 'country'],
    numeric_column='quantity',
    color_column='fruit')
ch.show('png')

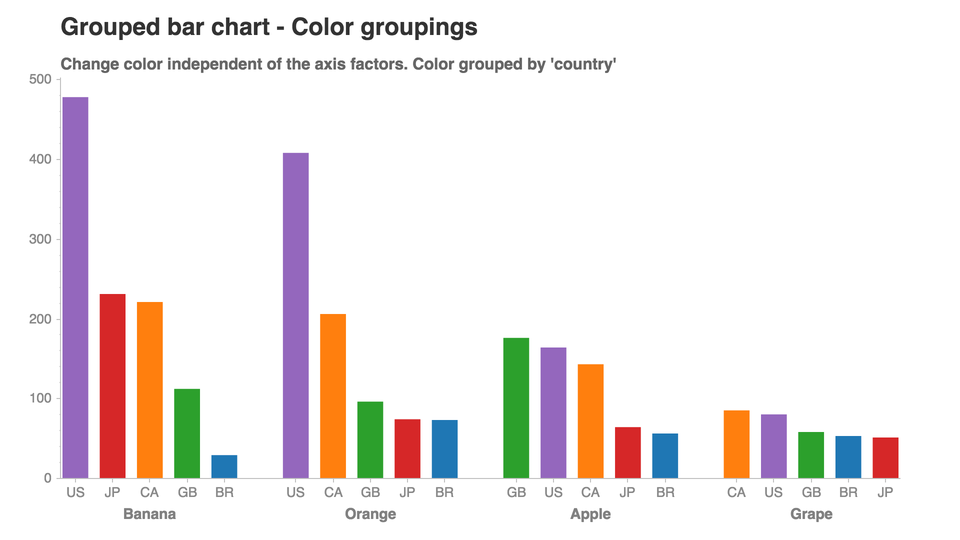
ch = chartify.Chart(blank_labels=True, x_axis_type='categorical')
ch.set_title("Grouped bar chart - Color groupings")
ch.set_subtitle(
    "Change color independent of the axis factors. Color grouped by 'country'"
)
ch.plot.bar(
    data_frame=quantity_by_fruit_and_country,
    categorical_columns=['fruit', 'country'],
    numeric_column='quantity',
    color_column='country')
ch.show('png')
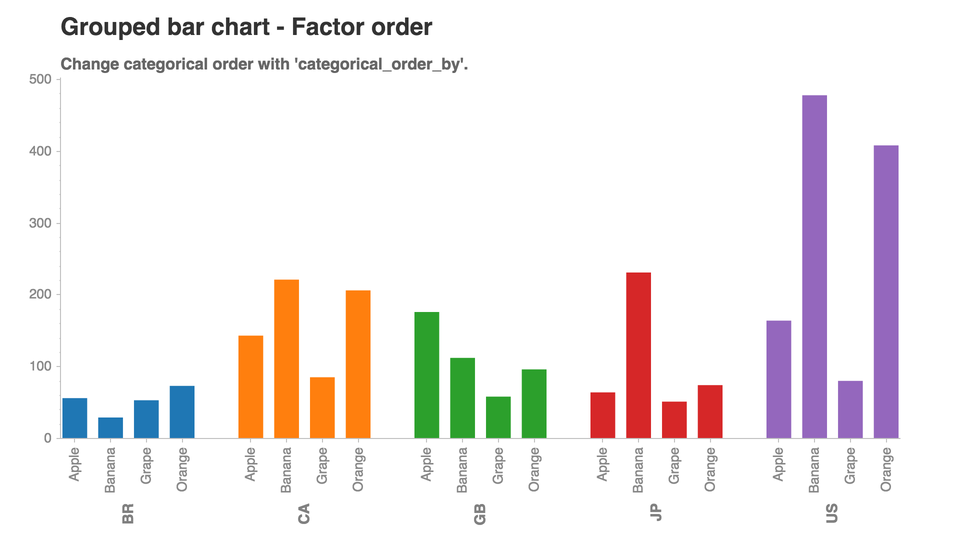
ch = chartify.Chart(blank_labels=True, x_axis_type='categorical')
ch.set_title("Grouped bar chart - Factor order")
ch.set_subtitle("Change categorical order with 'categorical_order_by'.")
ch.plot.bar(
    data_frame=quantity_by_fruit_and_country,
    categorical_columns=['country', 'fruit'],
    numeric_column='quantity',
    color_column='country',
    categorical_order_by='labels',
    categorical_order_ascending=True)
ch.axes.set_xaxis_tick_orientation('vertical')
ch.show('png')
Lollipop
quantity_by_fruit_and_country = (data.groupby(
    ['fruit', 'country'])['quantity'].sum().reset_index())
print(quantity_by_fruit_and_country.head())

    fruit country  quantity
0  Apple      BR        57
1  Apple      CA       144
2  Apple      GB       177
3  Apple      JP        65
4  Apple      US       165

# Plot the data
ch = chartify.Chart(blank_labels=True, y_axis_type='categorical')
ch.set_title("Lollipop chart")
ch.set_subtitle("Same options as bar plot")
ch.plot.lollipop(
    data_frame=quantity_by_fruit_and_country,
    categorical_columns=['country', 'fruit'],
    numeric_column='quantity',
    color_column='country')
ch.show('png')

Bar (Stacked)
quantity_by_fruit_and_country = (data.groupby(
    ['fruit', 'country'])['quantity'].sum().reset_index())
print(quantity_by_fruit_and_country.head())

    fruit country  quantity
0  Apple      BR        57
1  Apple      CA       144
2  Apple      GB       177
3  Apple      JP        65
4  Apple      US       165

# Plot the data
(chartify.Chart(blank_labels=True,
                x_axis_type='categorical')
    .set_title("Stacked bar chart")
    .set_subtitle("Stack columns by a categorical factor.")
    .plot.bar_stacked(
        data_frame=quantity_by_fruit_and_country,
        categorical_columns=['fruit'],
        numeric_column='quantity',
        stack_column='country',
        normalize=False)
    .show('png'))

 # Add a column for labels.
# Note: Null labels will not be added to the chart.
quantity_by_fruit_and_country['label'] = np.where(
quantity_by_fruit_and_country['country'].isin(['US', 'CA']),
quantity_by_fruit_and_country['quantity'],
None)

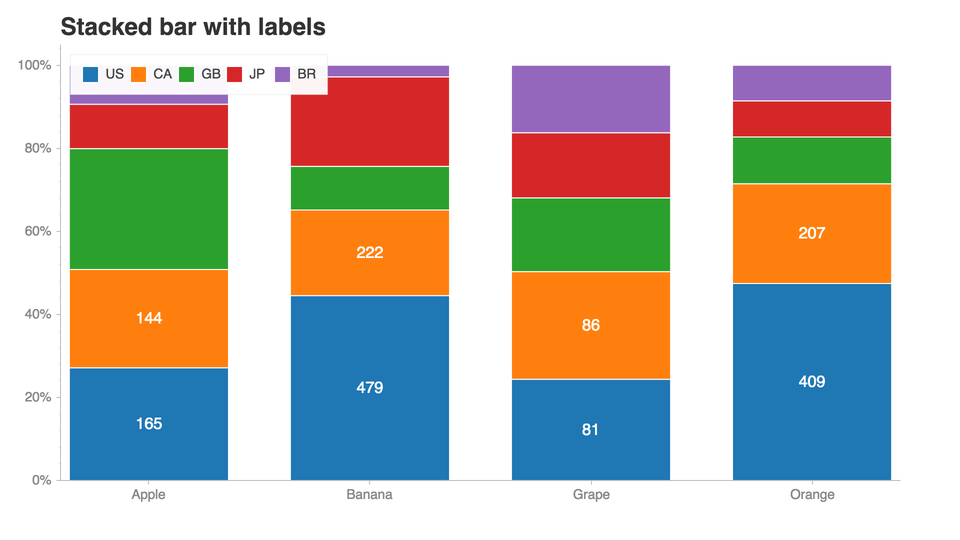
(chartify.Chart(blank_labels=True, x_axis_type='categorical')
.set_title("Stacked bar with labels")
.set_subtitle("")
.plot.bar_stacked(
    data_frame=quantity_by_fruit_and_country,
    categorical_columns=['fruit'],
    numeric_column='quantity',
    stack_column='country',
    normalize=True,
    stack_order=country_order)
.plot.text_stacked(
    data_frame=quantity_by_fruit_and_country,
    categorical_columns=['fruit'],
    numeric_column='quantity',
    stack_column='country',
    text_column='label',
    normalize=True,
    stack_order=country_order,
    # Set the text color otherwise it will take
    # The next color in the color palette.
    text_color='white'
    )
.show('png'))
Parallel coordinate plot
total_quantity_by_fruit_and_country = (data.groupby(
    ['fruit', 'country'])['quantity'].sum().reset_index())
print(total_quantity_by_fruit_and_country.head())

    fruit country  quantity
0  Apple      BR        57
1  Apple      CA       144
2  Apple      GB       177
3  Apple      JP        65
4  Apple      US       165

# Plot the data
ch = chartify.Chart(blank_labels=True, x_axis_type='categorical')
ch.set_title("Parallel coordinate charts")
ch.set_subtitle("")
ch.plot.parallel(
    data_frame=total_quantity_by_fruit_and_country,
    categorical_columns='fruit',
    numeric_column='quantity',
    color_column='country')
ch.show('png')

Heatmap
```average_price_by_fruit_and_country = (data.groupby(
    ['fruit', 'country'])['total_price'].mean().reset_index())

```python
(chartify.Chart(
    blank_labels=True,
    x_axis_type='categorical',
    y_axis_type='categorical')
    .plot.heatmap(
    data_frame=average_price_by_fruit_and_country,
    x_column='fruit',
    y_column='country',
    color_column='total_price',
    text_column='total_price',
    text_color='white')
    .axes.set_xaxis_label('Fruit')
    .axes.set_yaxis_label('Country')
    .set_title('Heatmap')
    .set_subtitle("Plot numeric value grouped by two categorical values")
    .show('png'))

Single density axis
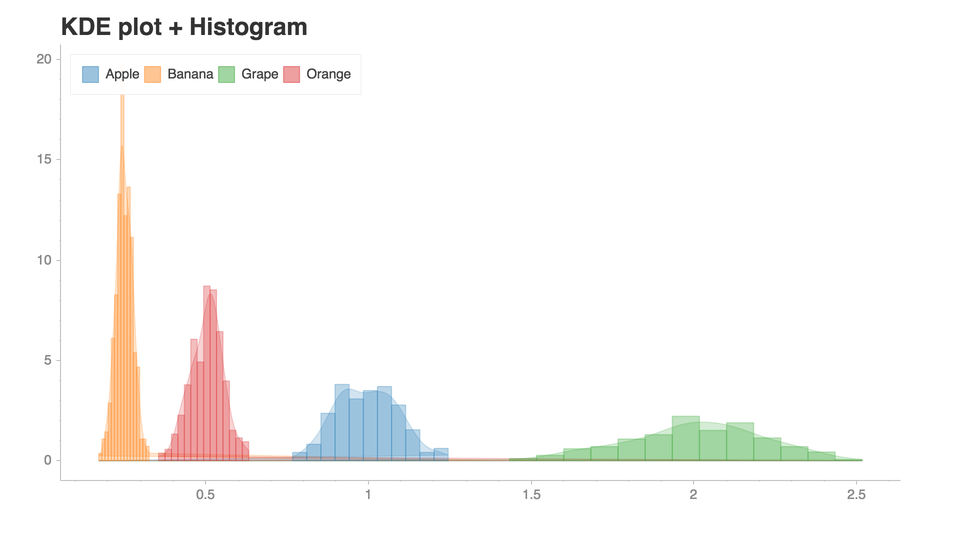
# Plot the data
ch = chartify.Chart(blank_labels=True, y_axis_type='density')
ch.set_title("KDE plot + Histogram")
ch.plot.kde(
    data_frame=data,
    values_column='unit_price',
    color_column='fruit')
ch.style.color_palette.reset_palette_order()
ch.plot.histogram(
    data_frame=data,
    values_column='unit_price',
    color_column='fruit',
    method='density')
ch.show('png')
Radar chart
total_by_fruit_and_country = data.groupby(['fruit', 'country'])['quantity'].sum().reset_index()
print(total_by_fruit_and_country.head())

fruit country  quantity
0  Apple      BR        57
1  Apple      CA       144
2  Apple      GB       177
3  Apple      JP        65
4  Apple      US       165

ch = chartify.RadarChart(True, layout='slide_50%')
ch.set_title('Radar Area Chart')
ch.set_subtitle("Each vertex plotted counterclockwise starting from top")
ch.plot.text(total_by_fruit_and_country.groupby('country')['quantity'].max().reset_index(),
                'quantity',
                text_column='country',
                text_align='center')
ch.plot.area(total_by_fruit_and_country, 'quantity', color_column='fruit')
ch.axes.hide_yaxis()
ch.axes.hide_xaxis()
ch.set_legend_location('outside_bottom')
ch.show('png')

Color Palettes
There are many color palettes that you can use in chartify.
chartify.color_palettes
Color Palettes:
'Category20'
'Category10'
'Colorblind'
'Dark2'
'Pastel1'
'RdBu'
'RdGy'
'Greys'
'Greens'
'Blues'
'Reds'
'Oranges'
'All colors'
chartify.color_palettes.show()