I completed the project about doing statistical analysis on Nortwind dataset. One of the most time-consuming parts was the test assumptions. I choose to run Welch’s t-test, one-way ANOVA and two-way ANOVA for my four questions in the project. All have a separate set of assumptions.
If you have ever dealt with inferential statistics and hypothesis testing, you probably know what I am talking about. As far as my research so far, I believe they are mostly underestimated and kind of waived in real-world applications. However, those assumptions are actually part of the test and must be looked in to. Otherwise, the result might not be as accurate as you would think.
What are Test Assumptions?
In inferential statistics, there are many statistical tests that one can use for hypothesis testing. In every different scenario, you may find a few best-suited tests to utilize. However, running the statistical test right away is a wrong practice. Certain assumptions need to be assessed prior to analysis. Depending on the type of statistical analysis, the set of assumptions may vary. Some of the most common assumptions in statistics are normality and equality of variance.
Normality Assumption
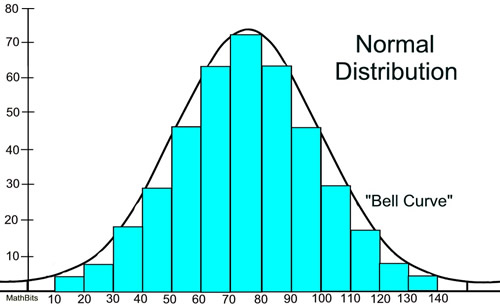
Normality assumption requires that the continuous variables to be used in the analysis are normally distributed. All parametric tests required some sort of normal distributed data (a.k.a. Gaussian Distribution). The tests are quite robust to departures of non-normality so the data needs to be approximately normally distributed. Plotting a histogram or QQ plot of the variable of interest will give an indication of the shape of the distribution. Histograms should peak in the middle and be approximately symmetrical about the mean follow a ‘bell-shaped’ distribution. If data is normally distributed, the points in QQ plots will be close to the line.


Normality is typically assumed in the tests for calculating mean differences (e.g., t-tests and ANOVAs/MANOVAs) and prediction analyses (e.g., linear regression analyses). **Normality can be examined by several methods, three of which are the Kolmogorov Smirnov (KS) test, Shapiro-Wilk test and the examination of skew and kurtosis. **
- The KS test utilizes the z test statistic, and if the corresponding p-value is less than .05 (statistical significance), then the assumption of normality is not met. In SciPy, we run this test using the method below:
python
stats.kstest(data['Quantity'], 'norm', args=(0,2))
Details on all arguments being passed in can be viewed at this link to the official doc.
- The Shapiro-Wilk Test evaluates a data sample and quantifies how likely it is that the data was drawn from a Gaussian distribution. The shapiro() SciPy function will calculate the Shapiro-Wilk on a given dataset. The function returns both the W-statistic calculated by the test and the p-value.
python
stats.shapiro(data['Quantity'])
Details on all arguments being passed in can be viewed at this link to the official doc.
- Also, normality can be defined as skew below ± 2.0 and kurtosis below ± 7.0, and if the observed values exceed these boundaries, then the assumption of normality is not met.
What if the tests disagree, which they often will?
You can either investigate why your data is not normal and perhaps use data preparation techniques to make the data more normal. I would recommend only removing some of the outliers but not performing other methods such as scaling and normalization. If that does not work you can start looking into the use of nonparametric statistical methods instead of the parametric methods.
Sometimes your data seems close to normal even if not perfect. In many situations like that, you can treat your data as though it is Gaussian and proceed with your chosen parametric statistical methods.
Equality of variance
Equality of variance (a.k.a., homogeneity of variance) refers to equal variances across different groups or samples. Equality of variance is usually required for testing mean differences on an independent grouping variable (e.g., t-tests and analyses of variance – ANOVAs/MANOVAs). Equality of variance can be assessed by utilizing Levene’s test for each continuous, dependent variable.
- Levene’s test runs the F test, and if the corresponding p-value is less than .05 (statistical significance), then the assumption of the equality of variance is not met.
python
stats.levene(sample1group1, sample1group2, sample1group3..
Details on all arguments being passed in can be viewed at this link to the official doc.